The Largest Sample of Microlensing Events and the Structure of the Galactic Bulge from the OGLE-III Survey
We present and study the largest and the most comprehensive catalog of microlensing events ever constructed. The sample of standard microlensing events comprises 3718 unique events from years 2001-2009, with 1410 not detected before in real-time by the Early Warning System (EWS) of the Optical Gravitational Lensing Experiment (OGLE). The search pipeline makes use of Machine Learning algorithms in order to help find rare phenomena among 150 million objects and derive the detection efficiency. Applications of the catalog can be numerous, from analyzing individual events to large statistical studies for the Galactic mass and kinematics distributions and planetary abundances.
We derive the maps of the mean Einstein ring crossing time of events spanning 31 sq. deg. toward of the Galactic Center and compare the observed distributions with the most recent models. We find good agreement within the observed region and we see the signature of the tilt of the bar in the microlensing data. However, the asymmetry of the mean time-scales seems to rise more steeply than predictions, indicating either a somewhat different orientation of the bar or a larger bar width. The map for the events with sources in the Galactic bulge shows a dependence of the mean time-scale on the Galactic latitude, signaling an increasing contribution from disk lenses closer to the plane, related with the height of the disk. Our data present a perfect set for comparing and enhancing new models of the central parts of the Milky Way and creating the 3D picture of the Galaxy.
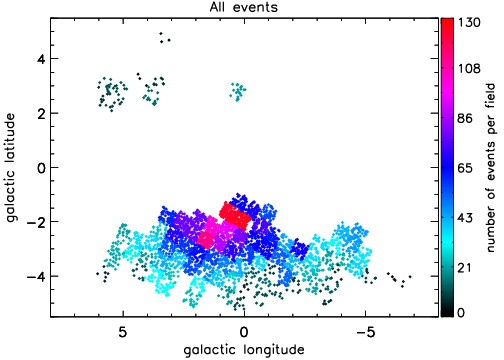
Figure shows the density of all standard events found in the OGLE-III data. The color of each dot indicates the number of events found in the OGLE-III field containing that event. Each field had 8 independent CCD chips and covered 0.34 sq. deg.
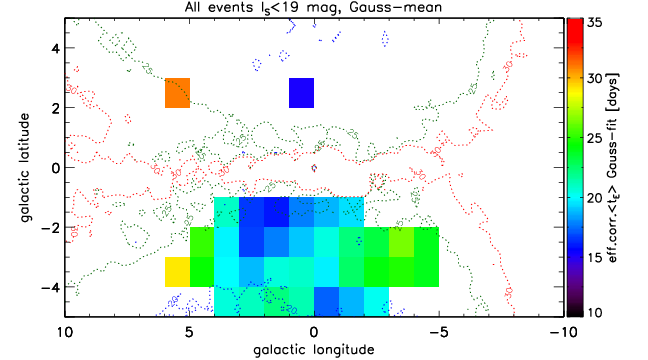
Efficiency corrected mean tE map for 1185 events with source (resolved) magnitude brighter than 19 mag and relative error of tE better than 50%. Dashed contours show the expected mean time-scale (at 20, 25 and 30 days) as computed in Kerins et al. (2009). Within each bin (size 1×1 degree) the mean time-scale was computed from the log-normal fit to the distribution.
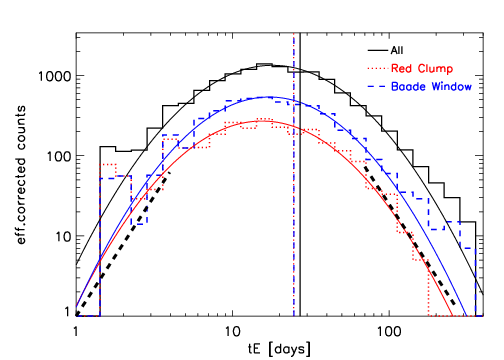
Distribution of the logarithm of the Einstein Radius crossing times (tE) for All events (black solid), Red Clump source events (red dotted) and around the Baade's Window (blue dashed). The Gauss-fit mean values of tE are marked with corresponding vertical lines (27.0, 24.5, 24.6 days, respectively). Thick dashed lines indicate power-law slopes of +3 and -3 for short and long time-scale tails, respectively.
The data, including light curves of events, table with microlensing
parameters as well as MCMC models plots, is available in
the OGLE Internet archive
PLEASE cite the following paper when using the data or referring to
these OGLE results:
Wyrzykowski et al., 2014,
ApJS,
(arxiv:1405.3134)
Any comments about the results, the data and the form of their presentation are welcome.
Send your messages to this address.